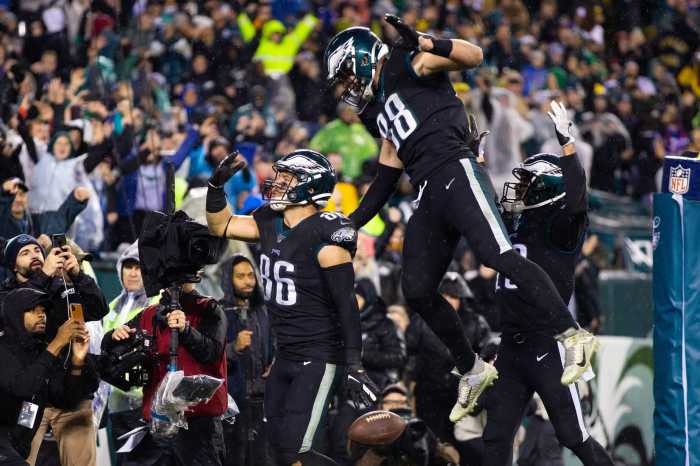
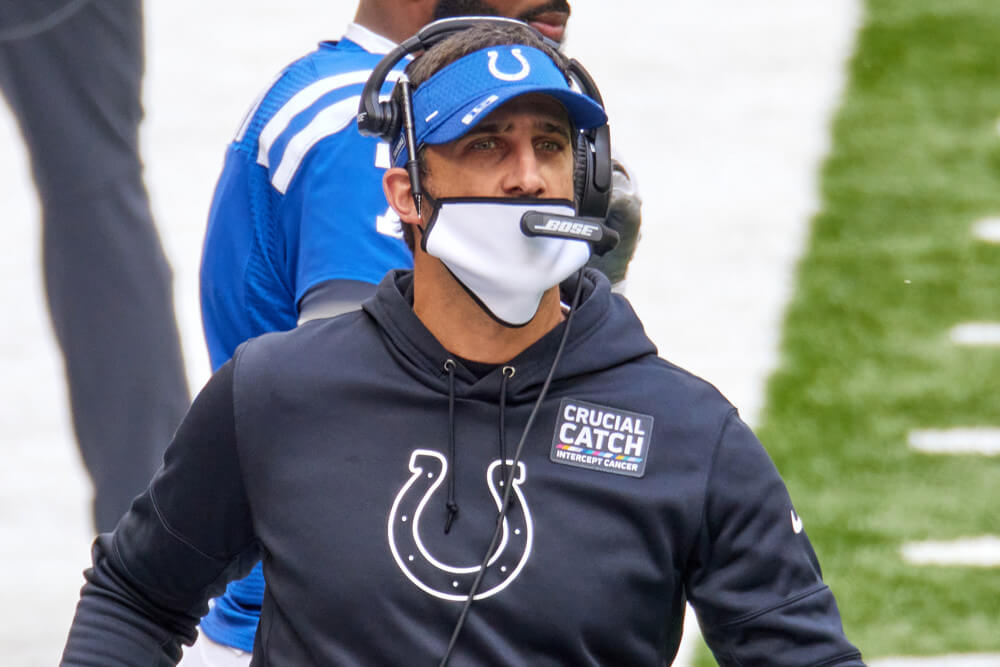
The Eagles have concluded the search for their head coach of the future. Indianapolis Colts’ OC Nick Sirianni will make the trek over from the AFC to take the reigns of a disjointed Philly team. While nothing is for sure until the Birds take the field in September, the hire is being lauded by many. Those that have worked with Coach Sirianni or know him personally have vouched for his work ethic and leadership.
For Eagles fans, there is a certain level of familiarity that comes with the hire. Sirianni spent the last three years coaching under former Eagles’ OC Frank Reich. The three years prior he spent in San Diego as their QB/ Offensive Quality Control Coach. He also spent four years in Kansas City although he never overlapped with Andy Reid.
From the outset, there are a lot of similarities with the offensive scheme of Sirianni and former Eagles head coach Doug Pederson. Ball control and a multi-attack offense are at the core of both schemes. Each coach has the ability to be versatile, balancing run and pass, and likes to deploy multiple formations to take advantage of matchups.
The main difference, from the eye test, is efficiency and consistency. Nobody loved to gamble more than Doug Pederson. That often proved costly and led to some questionable decision making. He also could be quite rigid with his plan of attack, most notably forcing the ball through the air when the ground game was rolling. Both of these factors caused the offensive numbers to jump all over the place.
With Sirianni, the consistency is obvious. You will notice as we look at the numbers, whether it’s a good season or a down one, there are many outcomes that remain consistent. Although consistency and versatility don’t always go hand-in-hand, it has been his adaptability that garnered so much success in Indianapolis.
Let’s dive into the numbers.
Production
There’s nothing that jumps off the page about the Colts’ offensive production over the last three years, save for some solid 2018 numbers. The most impressive part of the chart below is the Colts’ scoring percentage and their turnover rate. The word consistent is already coming into play.
2019 was a forgettable year for Indianapolis — essentially a transition year, with few offensive weapons. Yet still, they were middle of the pack in both categories. This season, with savvy Philip Rivers under center, the Colts turned the ball over only 15 times all season.
In terms of yardage, Sirianni’s offense has produced steadily on the ground despite a wide range of quarterback play. The 2018 combo of Marlon Mack and rookie Nyheim Hines may have been a weak spot, but with Andrew Luck at the helm, the offense could more than afford it.
What’s important to note is not necessarily the total production, but the adjustment Sirianni was able to make to each quarterback, while maintaining a relatively steady production.
| Colts | 2018 | 2019 | 2020 |
| Yds/Play | 5.8 | 5.2 | 5.9 |
| Turnovers | 24 (22nd) | 21 (16th) | 15 (3rd) |
| Yds/Att | 5.8 (9th) | 5.2 (25th) | 5.9 (9th) |
| Yds/Rush | 4.2 (22nd) | 4.5 (11th) | 4.3 (14th) |
| Scoring % | 41.2 (6th) | 36.3 (15th) | 44.4 (10th) |
| Turnover % | 13.2 (9th) | 11.3 (15th) | 8.8 (4th) |
| Avg Drive | 2.39 (20th) | 2.52 (5th) | 2.55 (9th) |
Comparing the numbers above to the Eagles numbers under Doug Pederson over that time, you’ll notice a lot of similarities. The two big differences being the worsening turnover and scoring percentages.
| Eagles | 2018 | 2019 | 2020 |
| Yds/Play | 5.6 | 5.2 | 5.0 |
| Turnovers | 23 (20th) | 23 (19th) | 29 (30th) |
| Yds/Att | 6.7 (10th) | 5.9 (20th) | 5.0 (32nd) |
| Yds/Rush | 3.9 (30th) | 4.3 (19th) | 5.0 (3rd) |
| Scoring % | 38.1 (13th) | 34.0 (17th) | 27.9 (31st) |
| Turnover % | 12.5 (17th) | 10.7 (19th) | 15.3 (31st) |
| Avg Drive | 2.58 (3rd) | 2.50 (7th) | 2.28 (31st) |
You’ll notice as well that both teams held the ball for long, sustained drives. However, the Colts under the strong-armed Andrew Luck were more willing to chuck the ball downfield, resulting in some quick scores. With a similarly strong QB, those long balls just didn’t connect for the Eagles — see 2020.
In the chart below you’ll see that despite fielding a putrid offense last season, the Eagles still ran the 6th most plays — and yet were second last in average drive time. That was mostly due to Pederson’s refusal to run the ball in spite of a rocky pass attack.
That hasn’t been an issue for Sirianni, whose team handed the ball off the 10th most last year despite having Rivers taking snaps. In fact, despite having a QB used to launching the football game in and game out, the Colts limited Rivers’ pass attempts.
| 2018 | 2019 | 2020 | ||
| Plays | Eagles | 8th | 1st | 6th |
| Colts | 3rd | 18th | 16th | |
| Pass Att | Eagles | 7th | 8th | 10th |
| Colts | 2nd | 24th | 20th | |
| Rush Att | Eagles | 20th | 7th | 23rd |
| Colts | 17th | 5th | 10th | |
| RZ Att | Eagles | 9th | 10th | 28th |
| Colts | 4th | 8th | 5th | |
| RZ TD % | Eagles | 17th | 3rd | 15th |
| Colts | 5th | 6th | 17th | |
| 3rd % | Eagles | 11th | 4th | 28th |
| Colts | 1st | 12th | 21st |
However, what is most impressive about the chart above is the Colts’ consistency in red zone attempts. Sirianni’s offense seems able to habitually reach the opposing 25, although the results vary when they get there. The combination of Dallas Goedert and Zach Ertz (should he stay in Philly) will help with that. Outside of Eric Ebron in 2018, the Colts’ offense hasn’t really had that big red zone threat.
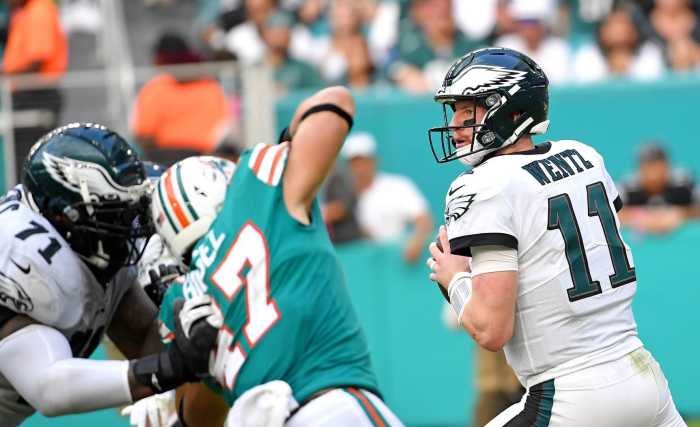
Both teams have had a big variance in their pass to run ratios, however, with the Colts you see a bit less of a dramatic swing one way or the other. There is also less of a dedication to the pass, which is good news for Carson Wentz’s arm. Although ball control is important for Sirianni’s offense, running a staggering number of plays is clearly less significant.
Efficiency
While both teams enjoyed two playoff seasons and an off-year, there was a noticeable difference in efficiency — especially during that down year. In 2018 the Colts were hampered by sub-par quarterback play as were the Eagles last season. Even at its best, the Eagles’ offense was never as efficient as Indy. However, in their respective bad seasons, the Colts were able to stay closer to the middle of the pack due to their consistently efficient rushing attack.
| 2018 | 2019 | 2020 | ||
| Weighted DVOA | Eagles | 2.7% (14th) | 0.6% (14th) | – 16.9% (27th) |
| Colts | 14.2% (5th) | – 7.8% (23rd) | 6.5% (10th) | |
| Pass DVOA | Eagles | 18.6% (13th) | 13.2% (17th) | – 12.1 (29th) |
| Colts | 22.2% (11th) | – 0.8% (25th) | 14.3 (16th) | |
| Rush DVOA | Eagles | – 16.1 (23rd) | – 3.9% (13th) | – 10.2% (18th) |
| Colts | – 6.7 (13th) | – 0.7% (8th) | – 5.4 (12th) | |
| Drive Success | Eagles | .027 (10th) | .047 (4th) | – .013 (20th) |
| Colts | .049 (7th) | .023 (10th) | .027 (10th) |
Facing struggles under center, Sirianni found a way to get the most of his ground game, registering his most efficient year. The Eagles’ efficiency in 2020 fell off a cliff, although it wasn’t that high to begin with. The results show in the overall drive success. The Eagles finished an impressive 4th in 2019, but the Colts finished in the top 10 all three seasons. That’s consistency.
Personnel
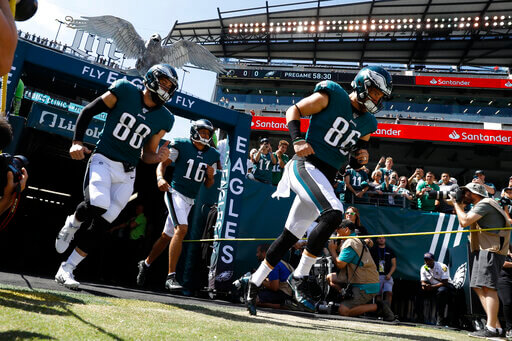
Personnel often depends on the players you have at your disposal, however, there are some things to gain from looking at how the Colts have lined up over the past three years. The Eagles regularly eclipse the rest of the league in 12 personell-usage, having one of the best one-two TE punches in the NFL. However, the Colts haven’t been shy about it either. Now with Ertz and Goedert at his disposal, Sirianni may up those numbers. Even with a smaller usage rate, Indianapolis had almost identical success rates with 12-personnel.
The biggest differences are the Colts’ use of base (1-1-3), two back and three tight end packages. The Eagles opted out of base packages in favor of 1-2 personnel to make good use of Goedert and Ertz, or Rodgers. However, it was Sirianni who used more three tight end sets – Pederson barely using it at all. Some of that was due to the availability of three tight ends — but even when all three were healthy this season, the Eagles only used three tight end packages on 2% of their plays. Trotting three tight ends onto the field often indicates a run or a hard play-action — both of which the Eagles were missing in 2020.
| RB-TE-WR | 1-1-3 | 1-2-2 | 2-1-2 | 2-2-1 | 1-3-1 | Empty | |
| 2018 | Eagles | 56% | 36% | 0% | 1% | 6% | 1% |
| Success | 46% | 50% | 0% | 33% | 43% | 21% | |
| Colts | 72% | 18% | 3% | 1% | 5% | 2% | |
| Success | 52% | 51% | 55% | 50% | 36% | 46.5 | |
| 2019 | Eagles | 41% | 52% | 2% | 1% | 3% | 0% |
| Success | 47% | 49% | 44% | 58% | 30% | 0% | |
| Colts | 62% | 26% | 3% | 0% | 7% | 1% | |
| Success | 46% | 51% | 49% | 0% | 38% | 25% | |
| 2020 | Eagles | 58% | 37% | 1% | 1% | 1% | 2% |
| Success | 44% | 47% | 30% | 13% | 36% | 64% | |
| Colts | 69% | 21% | 1% | 0% | 8% | 1% | |
| Success | 50% | 47% | 63% | 0% | 44 | 40% | |
| 2020 | Average | 60% | 20% | 8% | 4% | 2% | 1% |
| Success | 48% | 52% | 51% | 42% | 45% | 48% |
Although it was minuscule, the Colts also used more two-back sets. With all the versatile talent in the Eagles RB room, it’s fun to think of the possibilities. It may not amount to anything, but dreaming about the combinations of Corey Clement, Boston Scott, and Miles Sanders on the field at the same time is enticing.
The real tea with Nick Sirianni
Rush
Herein lies one of the major differences between the Colts and Eagles offenses over the last three years. Pederson has always been partial to stretching a defense laterally. That can result in some big chunks of yardage, but damage your run efficiency (as we saw above). The Eagles have a very athletic offensive line that excels when they are able to get out and running. However, too many times have we seen Miles Sanders tackled for a loss trying to turn the corner.
| End | Tackle | Middle | ||
| 2018 | Eagles | 32% | 16% | 52% |
| Colts | 22% | 20% | 58% | |
| 2019 | Eagles | 33% | 22% | 45% |
| Colts | 30% | 10% | 60% | |
| 2020 | Eagles | 25% | 24% | 51% |
| Colts | 24% | 19% | 57% |
North-South has always been the right way to run the football. Sirianni understands this — pounding the football up the middle on nearly 60% of his run plays. That doesn’t mean an end to pulling the guards or Jason Kelce, as he also loves to get the ball on the perimeter. However, you may see fewer stretch zone plays.
Pass
Target percentages have a lot to do with your roster, and it shows with the Birds. They were consistently at the top of the league in tight end targets. The assumption that these targets would be taken away from the receivers, but in this case, it mostly resulted in the Eagles having low RB target rates.
| WR % | RB % | TE % | ||
| 2018 | Eagles | 46.9 | 17.3 | 35.7 |
| Colts | 53.3 | 20.3 | 26.4 | |
| 2019 | Eagles | 42.2 | 18.9 | 38.9 |
| Colts | 52.4 | 18.7 | 29.0 | |
| 2020 | Eagles | 52.5 | 17.3 | 30.2 |
| Colts | 52.4 | 25.2 | 22.4 |
In comparison to the Colts, aside from 2019, Philadelphia targeted their backs at a much lower rate. RB Miles Sanders being the most explosive man on the roster after arriving in 2019, it’s a bit head-scratching. In 2020, Sirianni’s offense got the ball to their backs 25% of the time. That is fantastic news for Sanders, Scott, and Clement (assuming he is still on the roster). Although those numbers may not be quite so high with Ertz and Goedert demanding targets.
Overall, there are a lot of good signs for the new man in charge. Whoever he decides to bring on as an OC will have a major impact . Still, what the Eagles know they are getting is a dependable coach that brings an efficient and consistent offensive scheme. That is something that they desperately need going into the next chapter of Philadelphia football.
Photo by MSA/Icon Sportswire